Interaction Summary By Queue
The Interaction Summary By Queue Report provides a summary of the interactions for each queue for a given period. It also includes queue callback data with the callbacks requested, callbacks answered, callbacks unanswered, and callback wait time statistics. By default, this report is sorted alphabetically by tenant name and queue name.
Sample Report
|
|
|
Click image to enlarge |
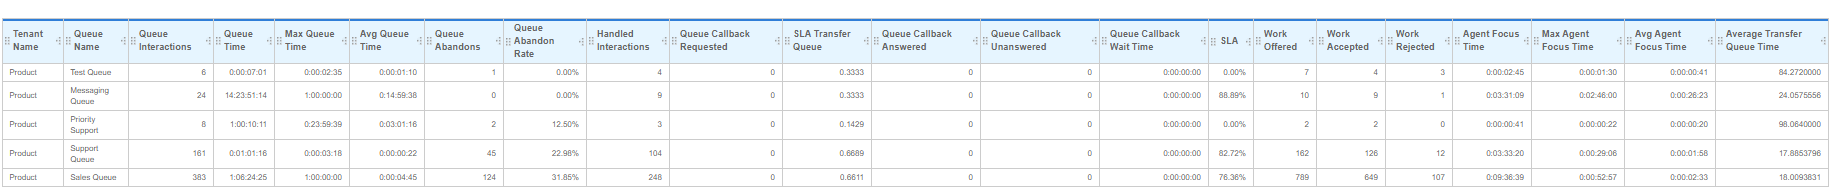
| This information is specific to this data set, with these metrics selected. The metrics itemized below will be pre-selected by default in Analysis. Adding or removing a column will modify data results as outlined on this page. |
Build the Interaction Summary By Queue report:
- Go to Reporting > Historical Reporting.
- In the sidebar, click Analysis

- From the Select Data drop-down menu, select the Interaction Summary By Queue data set.
- Click Ok and the table will load displaying the report data.
This table describes each column in the Interaction Summary by Queue report:
| Name | Type | Description |
|---|---|---|
| Tenant Name | Attribute | The name of the tenant that the agent was logged in to. |
| Queue Name | Attribute |
The name of the queue that the interaction waited in. |
| Queue Interactions |
Measure
|
The number of times that an interaction entered a queue. This includes:
This statistic does not include entries into a queue as a result of an agent rejecting the work. For example, if an interaction enters a queue, there is a count of 1. If the interaction is offered to an agent who rejects the work, the interaction goes back into the queue. This re-entry isn't counted. If an agent then accepts the interaction and later transfers it to another queue, the Queue Interactions count becomes 2. |
| Queue Time | Measure |
For the given date range, the total amount of time that elapsed across interactions from when they entered a queue until the work was either accepted by an agent or the caller abandoned. Total Queue Time is formatted in days, hours, minutes, and seconds (dd:hh:mm:ss). |
| Max Queue Time |
Measure |
For the given date range, the maximum amount of time that elapsed from when an interaction entered a queue until the work was either accepted by an agent or the caller abandoned. Maximum Queue Time is formatted in days, hours, minutes, and seconds (dd:hh:mm:ss). |
| Avg Queue Time | Measure |
For the given date range, the average amount of time that elapsed from when an interaction entered a queue until the work was either accepted by an agent or the caller abandoned. Average Queue Time is formatted in days, hours, minutes, and seconds (dd:hh:mm:ss). |
| Queue Abandons | Measure | The total number of calls that entered a queue and disconnected without being accepted by an agent. |
| Queue Abandon Rate | Measure | The total queue abandons calculation is the (total # of queue abandons / total # of queue interactions) x 100 for a given period. This calculation includes short abandons but excludes abandons that occur after the interaction is transferred. |
| Handled Interactions | Measure | The number of interactions (only received from a queue) that an agent accepts for a given date range. |
| Queue Callback Requested | Measure |
The number of inbound calls that requested a callback after entering and waiting in a queue. |
| SLA Transfer Queue | Measure | Percentage of interactions (expressed as decimal) that were transferred to a second queue and started an active conversation with an agent within a 60 second threshold. For example: A call enters the queue and is answered by Agent 1. Agent 1 transfers the call to another queue and Agent 2 answers the call within 30 seconds. This is where the SLA is being measured for this metric. In this example, the transfer counts as meeting SLA because Agent 2 answered the call in less than 60 seconds. The SLA is being measured when calls are in the queue for 60 seconds or less before they are answered. This metric represents the calls transferred to a second queue. If calls are transferred again to queues after this, those transfers are not considered as part of the SLA for Transfer Queue metric. This expression calculates the SLA value and displays it as a decimal. For example, a decimal value 0.76 for the SLA equals 76% of calls were answered within the 60 second threshold. |
| Queue Callback Answered | Measure |
The number of callbacks initiated that were answered by a customer. |
| Queue Callback Unanswered | Measure |
The number of callbacks that were initiated that a customer didn't answer. |
| Queue Callback Wait Time | Measure |
The amount of time from when the customer requested a callback to when the callback was initiated. |
| SLA | Measure |
Out of all the interactions that entered the queue, the percentage of interactions that started an active conversation with an agent within the configured SLA threshold. If short abandons are excluded in your SLA configuration, interactions that abandon within the configured abandon threshold aren’t counted. For more information on configuring SLA for your tenant or queues, see About Statistics Management. For tenants or queues that use CxEngage’s default SLA configuration, Formatted SLA uses the following thresholds:
This expression calculates the Formatted SLA value and displays it as a percentage up to one place after the decimal. |
| Work Offered | Measure | The total amount of interactions that were offered to agents for a given date range. This expression formats the statistic's value so that if there isn't any work offered, 0 displays in reports. In other words, if the value is null, 0 displays instead of a blank column. |
| Work Accepted | Measure | The number of work offers to an agent that were accepted during the given period of time. Work Accepted includes work that an agent receives from a queue, and work that was directly allocated to an agent and never entered a queue. |
| Work Rejected | Measure |
The number of work offers to an agent that were rejected during a given period of time. |
| Agent Focus Time | Measure |
The length of time that an interaction was selected and in focus in a Skylight Desktop product. |
| Max Agent Focus Time | Measure |
The longest time that an interaction was in focus during the specified date range. This statistic is reported for interactions that were handled in a Skylight Desktop product. |
| Avg Agent Focus Time | Measure |
The average focus time for all interactions during the specified date range. This statistic is reported for interactions that were handled in a Skylight Desktop product. |
| Average Transfer Queue Time | Measure | This metric measures the average queue time of interactions transferred to a second queue that started an active conversation with an agent. This expression calculates the ASA value and displays it in seconds. This can be formatted to Timespan, by left clicking on the column header and selecting Format >Timespan. |
