Performance By Channel Report in Historical Reporting
This report provides performance metrics for each channel. By default, the Performance by Channel report is sorted alphabetically by tenant name and channel.
| This information is specific to this data set, with these metrics selected. The metrics itemized below will be pre-selected by default in Analysis. Adding or removing a column will modify data results as outlined on this page. |
Build the Performance By Channel Report in report:
- Go to Reporting > Historical Reporting.
- In the sidebar, click Analysis

- From the Select Data drop-down menu, select the Performance By Channel Report in data set.
- Click Ok and the table will load displaying the report data.
Sample Report
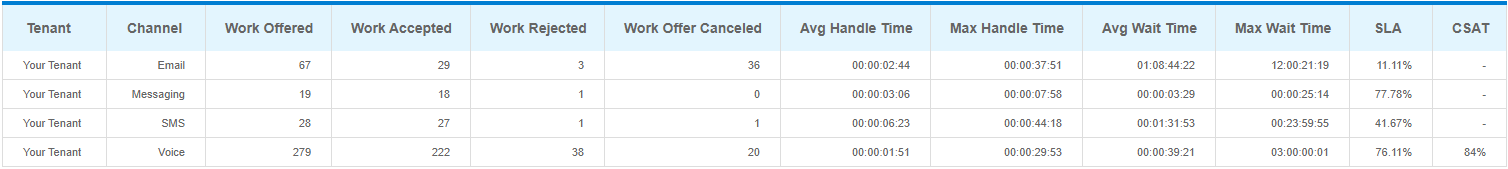
|
|
Click image to enlarge |
This table describes each column in the Performance by Channel report:
| Name | Type | Description |
|---|---|---|
| Tenant Name | Attribute | The name of the tenant that the agent was logged in to. |
| Channel | Attribute | The communication medium of the interaction. For example, voice, SMS, messaging, or email. |
| Work Offered | Measure | The total amount of interactions that were offered to agents for a given date range. |
| Work Accepted | Measure | The number of interactions that agents accepted for the given date range. |
| Work Rejected | Measure | The number of work offers to an agent that were rejected during a given period of time. |
| Avg Handle Time | Measure | The average amount of time that elapsed from when an agent accepts a work offer to when they end their wrap-up phase for a given date range. |
| Max Handle Time | Measure | The maximum amount of time that elapsed across interactions from when an agent accepted a work offer to when they ended their wrap-up phase for a given date range. |
| Avg Wait Time | Measure | For the given date range, the average amount of time that elapsed from when an interaction entered a queue until the work was either accepted by an agent or the caller abandoned. Average Queue Time is formatted in days, hours, minutes, and seconds (dd:hh:mm:ss). |
| Max Wait Time |
Measure |
For the given date range, the maximum amount of time that elapsed from when an interaction entered a queue until the work was either accepted by an agent or the caller abandoned. Maximum Queue Time is formatted in days, hours, minutes, and seconds (dd:hh:mm:ss). |
| SLA % | Measure |
Out of all the interactions that entered the queue, the percentage of interactions that started an active conversation with an agent within the configured SLA threshold. If short abandons are excluded in your SLA configuration, interactions that abandon within the configured abandon threshold aren’t counted. For more information on configuring SLA for your tenant or queues, see About Statistics Management. For tenants or queues that use CxEngage’s default SLA configuration, SLA Percent uses the following thresholds:
This expression calculates the SLA Percent value and displays it as a decimal up to two places after the decimal. |
| CSAT % |
Measure |
The satisfaction scores given by customers to rate the interaction as a percentage of the total possible score. |
