Queue Service Level by Day
This report summarizes each queue's service level statistics grouped by day for a given period of time. This report is sorted alphabetically by tenant name and queue name, and chronologically by date.
| This information is specific to this data set, with these metrics selected. The metrics itemized below will be pre-selected by default in Analysis. Adding or removing a column will modify data results as outlined on this page. |
Build the Queue Service Level by Day report:
- Go to Reporting > Historical Reporting.
- In the sidebar, click Analysis

- From the Select Data drop-down menu, select the Queue Service Level by Day data set.
- Click Ok and the table will load displaying the report data.
Sample Report
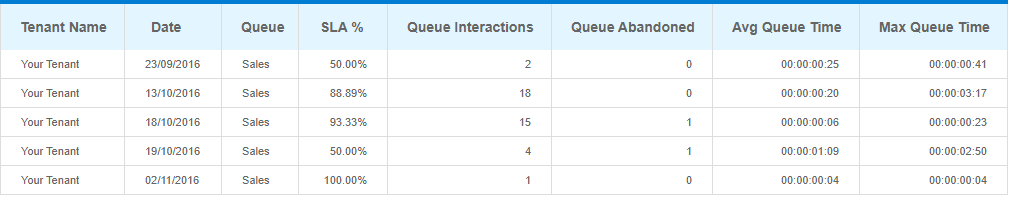
|
|
Click image to enlarge |
This table describes each column in the Queue Service Level by Day report:
| Name | Type | Description |
|---|---|---|
| Tenant Name | Attribute | The name of the tenant that the agent was logged in to. |
| Date | Attribute | The date in your tenant's timezone and in month, day, and year (mm/dd/yyyy) format. |
| Queue Name | Attribute | The name of the queue that the interaction waited in. |
| SLA % | Measure |
Out of all the interactions that entered the queue, the percentage of interactions that started an active conversation with an agent within the configured SLA threshold. If short abandons are excluded in your SLA configuration, interactions that abandon within the configured abandon threshold aren’t counted. For more information on configuring SLA for your tenant or queues, see About Statistics Management. For tenants or queues that use CxEngage’s default SLA configuration, SLA Percent uses the following thresholds:
|
| Queue Interactions | Measure |
The number of times that an interaction entered a queue. This includes:
This statistic does not include entries into a queue as a result of an agent rejecting the work. For example, if an interaction enters a queue, there is a count of 1. If the interaction is offered to an agent who rejects the work, the interaction goes back into the queue. This re-entry isn't counted. If an agent then accepts the interaction and later transfers it to another queue, the Queue Interactions count becomes 2. |
| Queue Abandons | Measure | The total number of calls that entered a queue and disconnected without being accepted by an agent. |
| Avg Queue Time | Measure | For the given date range, the average amount of time that elapsed from when an interaction entered a queue until the work was either accepted by an agent or the caller abandoned. Average Queue Time is formatted in days, hours, minutes, and seconds (dd:hh:mm:ss). |
| Max Queue Time |
Measure |
For the given date range, the maximum amount of time that elapsed from when an interaction entered a queue until the work was either accepted by an agent or the caller abandoned. Maximum Queue Time is formatted in days, hours, minutes, and seconds (dd:hh:mm:ss). |
