Dashboard Widgets Reference
Widgets on historical and realtime dashboards show visualizations and statistics relating to the interactions, agents, and queues in your tenant. Maximum (max), minimum (min), and average (avg) statistics in realtime dashboards reflect the current day. For Historical Dashboards, these statistics reflect the date range selected for the dashboard.
| Widget Type | Example |
|---|---|
|
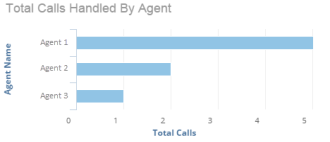
Bar Chart: Shows values as horizontal lengths. Bar charts are convenient to use when the labels for the data that you are visualizing (such as the names of agents or queues) are long. The additional space allows them to show without being rotated or cluttered as they could be on the x-axis of a column chart. |
|
|
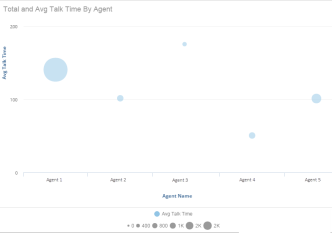
Bubble: Shows values as a set of bubbles. Data points are represented by a bubble with the addition of a third data series that provides the size of the bubbles. For example, in the Total and Avg Talk Time By Agent chart, the data series are:
Therefore, the bubble for agents with a the greatest amount of total talk time (such as 10,000 seconds) is larger than for agents with less total talk time (such as 2000 seconds). |
|
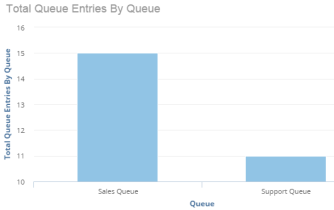
| Column Chart: Shows values as vertical lengths. |
|
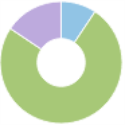
| Donut: Shows data in a donut shape with categories represented by individual sections. |
|
|
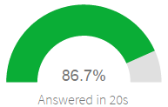
Gauge: Measures performance against a target. The gauge adjusts as interactions are processed. As a visual indicator, the color of the gauge changes depending on its value and corresponding threshold. For example, a gauge can show the percentage of interactions that met the Service Level Agreement (SLA) out of the total interactions. |
|
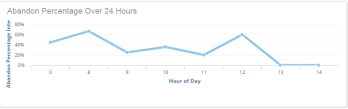
| Line: Shows a value's trend over time using a series of lines. |
|
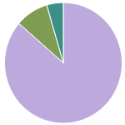
| Pie Chart: Shows values as percentage slices of a pie. |
|
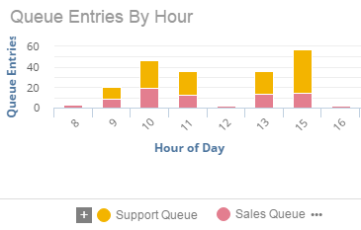
| Stacked Column: Shows all sets of data stacked in a single vertical column for each category. For example, on the Queue Entries by Hour chart, the volume of interactions that entered each queue is stacked on each other to show the total number of queue entries for the hour in the tenant. |
|
|
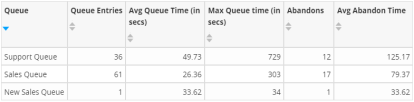
Table: Displays tabular data that consists of:
Click a column header to sort alphabetically or numerically in ascending or descending order. When the arrow in a column header points up, the column is sorted in ascending order (least to greatest or A to Z). When the arrow points down, the column is sorted in descending order (greatest to least or Z to A). |
|
| Value: Displays a number and its unit for a specific statistic. |
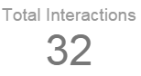
|
