Joining Data Sets in Analysis in Historical Reporting
| We recommend that an advanced CxEngage user with knowledge of databases and CxEngage reporting join data sets in Analysis to ensure that you get the data you're looking for. |
An Analysis a configured set of data and the foundation for the visualizations, reports, and dashboards that you create in historical reporting. In some circumstances, you may want your analysis to use columns from one data set with columns that are available in another data set.
When creating an Analysis, the following data sets can be joined:
- Interaction
- Interaction Agent
- Interaction Queue
- Interaction Segment
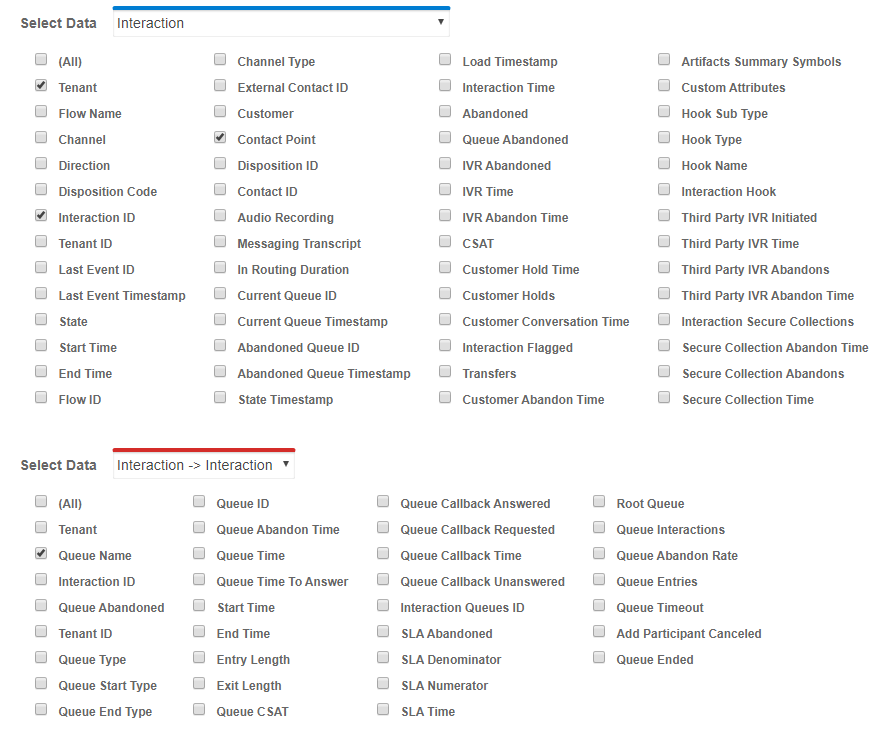
When you select one of these data sets, another Select Data menu appears with that you can join with the first data set. A colored bar shows above the data set selected in the Select Data menu. The columns belonging to that data set are highlighted with the same color in the table.
For example, you select the Interaction data set and a blue bar shows above it in the menu. You then join it with the Interaction Queue, which has a red bar showing above it in the menu:
|
|
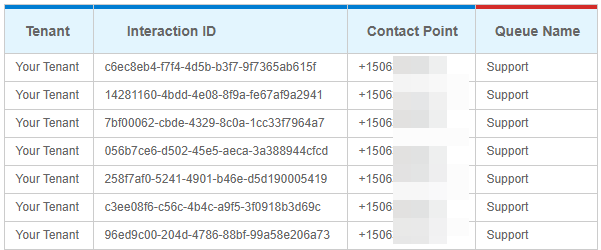
Click image to enlarge After you click OK to create a table from these data sets, the columns selected in the Interaction data set have a blue bar above them. The columns selected in the Interaction Queue data set have a red bar above them: |
|
|
Click image to enlarge |
Data sets joined the first data set is considered the first level of joins. We recommend that you don't exceed one level of table joins. Two or more levels of joins increases the complexity of the analysis and can result in the query timing out or data inaccuracies.
Consider the following scenario:
- The first data set you select is Interaction.
- You join Interaction to Interaction Agent (Interaction -> Interaction Agent). This is the first level of table joins because it is joined to the original data set.
- You also join Interaction to Interaction Queue (Interaction -> Interaction Queue). This is also the first level of table joins because it is joined to the original data set (Interaction).
- If you were to then join Interaction Agent to Interaction Segment (Interaction Agent -> Interaction Segment), this would be the second level of table joins because it isn't joined to the original data set. Joining tables beyond the first level isn't recommended.
